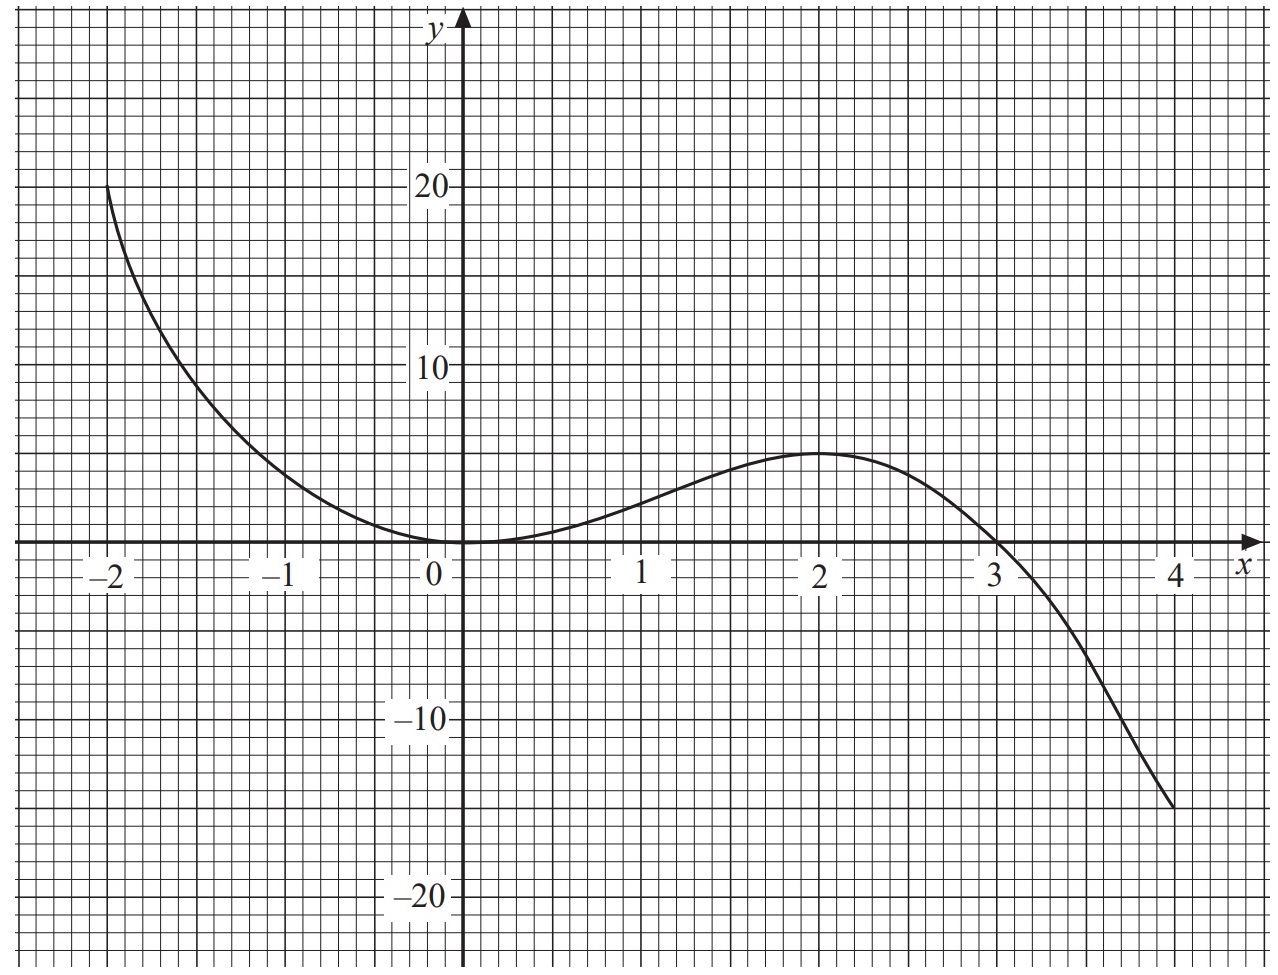
The diagram shows the graph of `y = 3x2 − x3` for `-2 < x < 4`.
The equation `k = 3x2 − x3` for `-2 < x < 4` has `2` solutions.
Write down the two values of `k` for which this occurs.
Your Answer:
You did not answer this question.

The diagram shows the graph of `y = 3x2 − x3` for `-2 < x < 4`.
The equation `k = 3x2 − x3` for `-2 < x < 4` has `2` solutions.
Write down the two values of `k` for which this occurs.
You did not answer this question.